
A few weeks ago I decided to try a social media experiment.
Given that many of my Facebook friends are fellow political junkies who cross the full spectrum of political affiliation, and given that discussions about “income equality” and minimum wage standards are becoming more frequent, I decided to sample my friends’ opinions in an amateur poll.
But this poll would be different. It would be completely transparent, meaning that respondents would be able to see responses from other respondents and that all responses could be viewed publicly. This poll would also allow respondents to self-select regarding their participation.
Before I proceed any further, I want to thank each of the respondents for their willingness to participate. For the most part, I don’t personally know most of those who responded. And that is the beauty of social media: the ability to connect and share ideas with others who are sometimes far outside our more traditional circle of friends and acquaintances. Each of these respondents, unlike those who participate in a traditional poll, were willing to share and “own” their opinions and answers publicly.
Though I was hoping for 50 participants, I decided to wrap up data collection after three days (December 8 – December 11, 2013) with 42 participants, including my own answers. The pool of respondents reflects about 5 percent of my 736 Facebook friends.
Now before anyone starts hyperventilating about this poll, its accuracy or its methodology, let’s clear up a few things:
1.) This is an amateur poll; a social media experiment. 2.) It was not paid for nor authorized by anyone; 3.) It is not intended to represent anything other than informal sampling of people I am connected to on social media. 4.) We must also assume that respondents were honest with their responses and did not alter their responses after the data was analyzed.
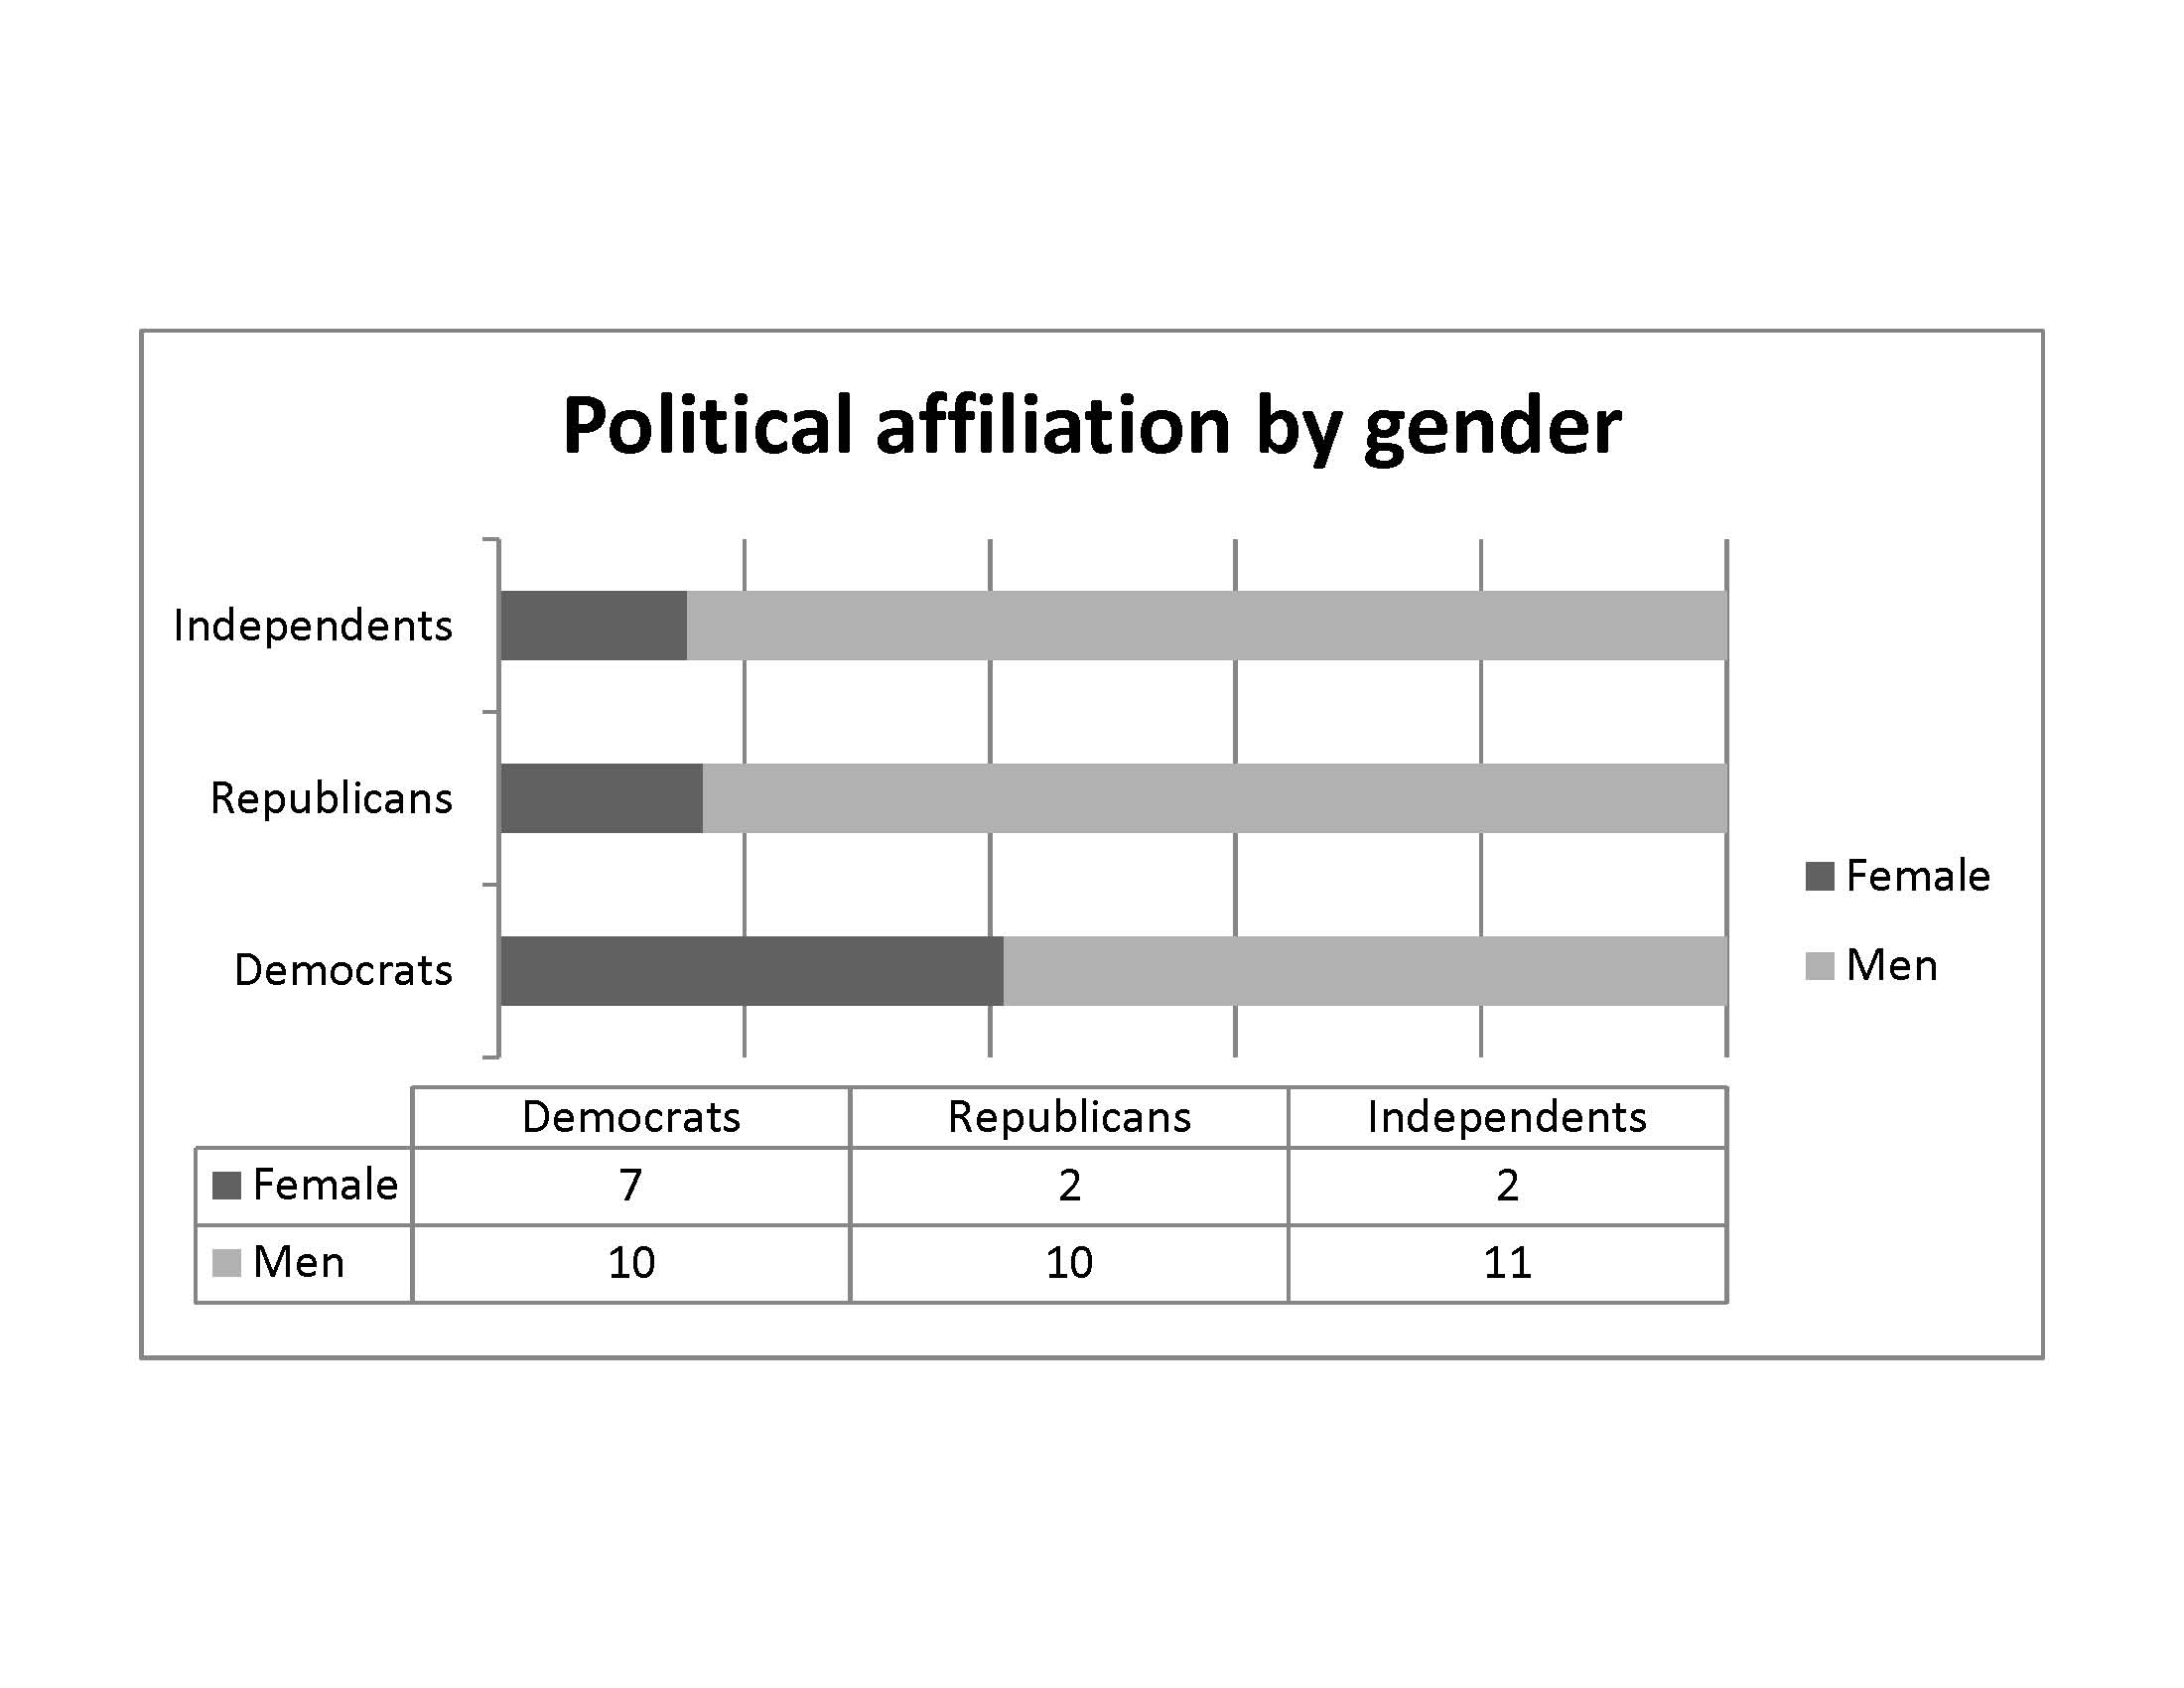
With all of that out of the way, let’s now look at the data. Clearly, the poll was weighted by male responses, but was nearly evenly split by political affiliations. Among the 42 respondents, there were 17 Democrats; 12 Republicans; and 13 Independents or un-enrolled. Thirty-one men and 11 women participated in the poll (Figure 1.1)
The poll was limited to three questions. The original Facebook post, along with the various replies and comments, can be viewed here.
Asked and answered
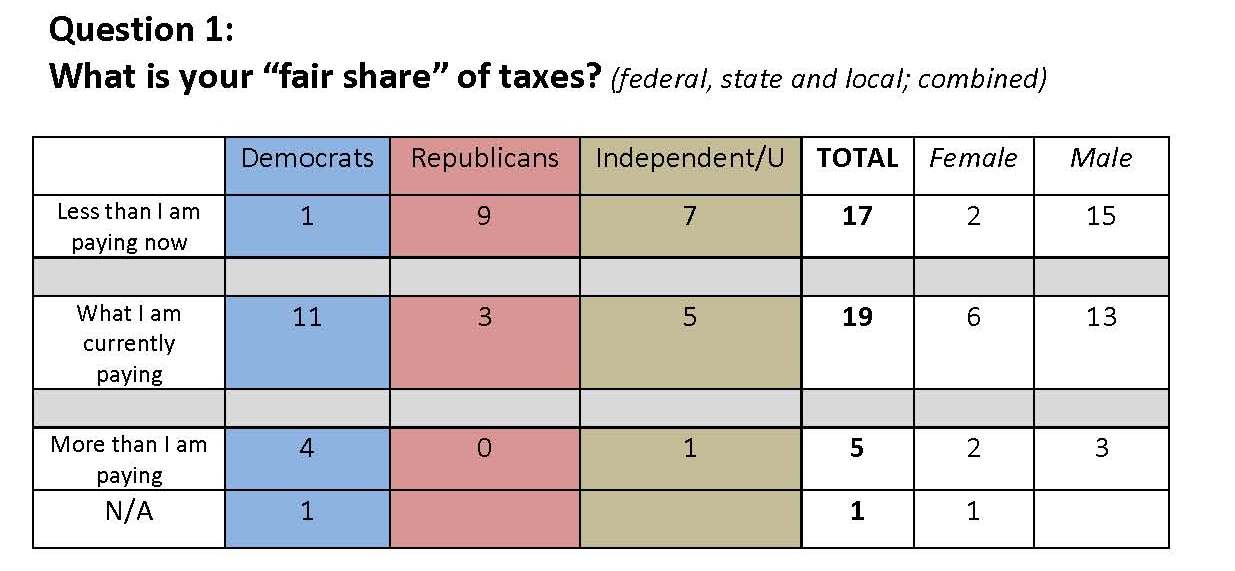
Question 1 asked respondents: What is your “fair share” of taxes (combined fed, state, local)?
Several respondents and others expressed disdain for my use of the word “fair” in the question. I responded that the word “fair” is certainly a subjective term, but the responses would also be subjective. Respondents were given three responses to choose from: A.) Less than you are now paying? B.) What you are currently paying? or C.) More than you are now paying? One respondent declined to answer the question.

There were no big surprises here. I was expecting to see a sharp divide between Democrats and Republicans, assuming Republicans would almost universally answer that they are already overtaxed and paying more than their “fair share.” What is interesting? Three Republicans (25 percent of Republican respondents) said they think their current tax obligation is “fair.” Both Democrats and Republicans, however, expressed frustration about local taxes rather than state or federal tax rates. See the chart (Figure 2.2) below for the breakdown of responses.
Question 2 asked respondents what they considered to be a “fair” minimum wage, providing four responses: A) Current minimum wage ($7.25/hour) B.) No less than 50% of the state’s median income. C.) No less than 75% of the state’s median income; or D.) There should not be a minimum wage.
Nearly 30 percent of respondents expressed confusion regarding responses that were tied to the state’s “median wage,” saying they did not know the current median wage or that it was a poor alternative for determining a state’s minimum wage requirement.
My theory is that minimum wage should be required by the federal government but not set to a national standard, other than as a percentage of a particular state’s median income.
My reasoning? Someone earning $7.25 per hour in Maine has less economic capacity than someone earning $7.25/hour in Tennessee, which has lower cost of living expenses. This disparity becomes more apparent in large urban areas, such as New York City or Chicago, creating an unlevel playing field.
For further clarification, it’s important to understand the difference between a “median” income and an “average” income. Median is simply the half-way point when looking at all recordable wages in a specified group. while it is common to discuss “household” median income, I used this chart from the University of New Mexico to compare median personal incomes among the 50 states. Maine ranks 28th with a median personal income of $39,481. This means 50 percent of income workers in Maine make less than $39,400/year.
If a Maine adult is working 40 hours at minimum wage, that person would be earning a gross income of $15,080 (assuming working 52 weeks per year). If we changed the state’s minimum wage to be no less than 50 percent of median income, that same person would now earn: $19,700 annually, considering an hourly wage of $9.47/hour. Lets see what my friends said:
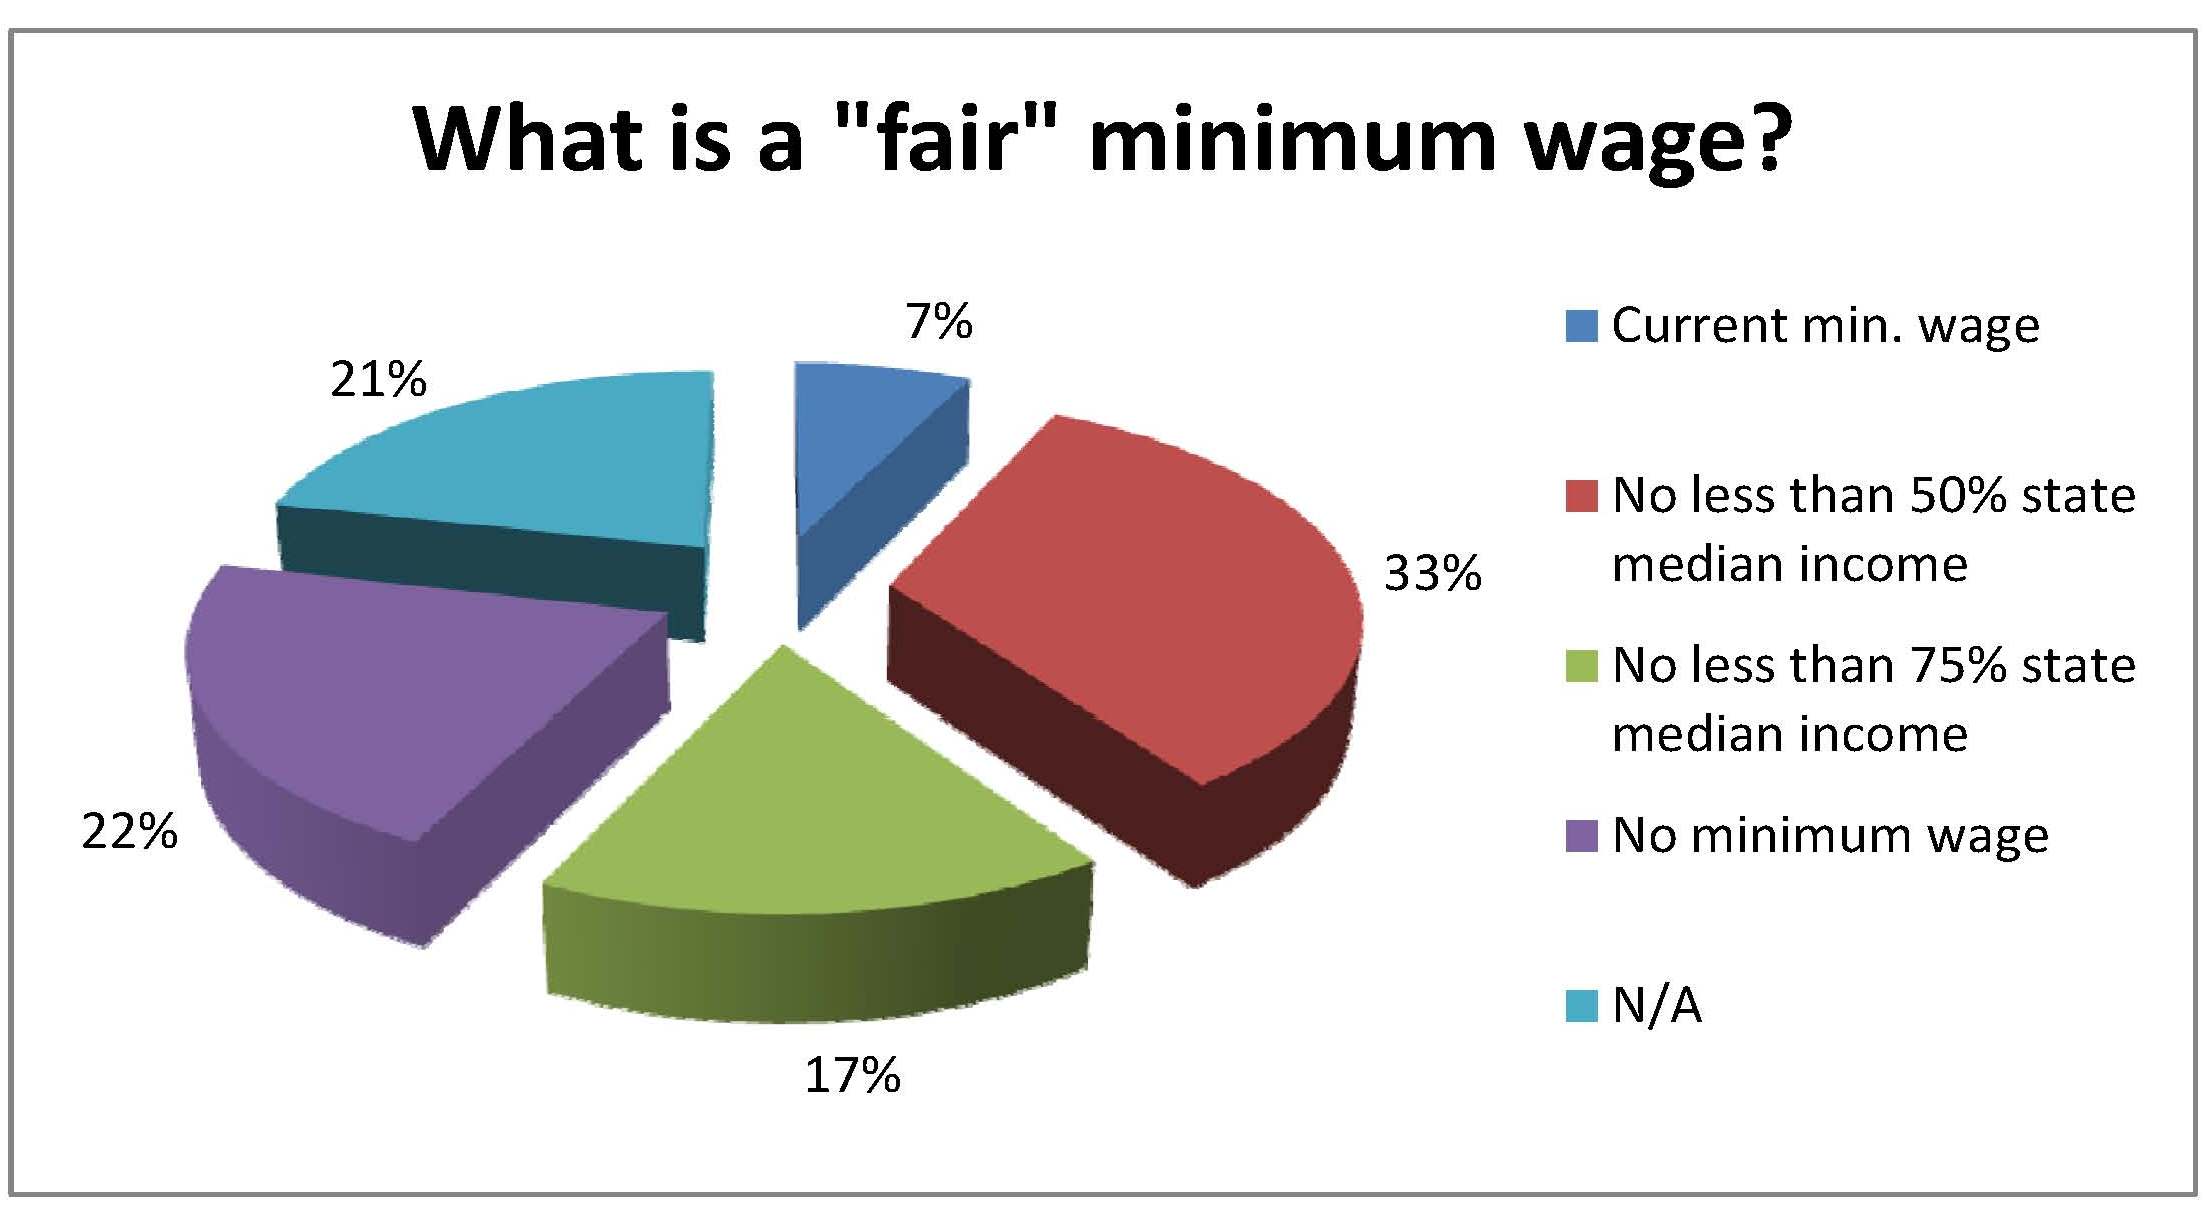
As we can see in the above chart (Figure 3.1), there is an almost even split between those who favor the current minimum wage or the idea of having no minimum wage (43 percent); and those who would like to see some level of increase (50 percent). Seven percent of respondents declined to pick one of the offered choices (as explained above).

The poll’s final question asked respondents if there should be a “maximum wage.” This question received the most universal agreement. 95 percent of respondents said there should NOT be a maximum wage, however, it should be noted that more than 40 percent of those indicated that they would like to see increased tax brackets for high wage earners. Only two Democrats (one male, one female) answered in the affirmative.

Of course, I have some opinions about this data, and some other thoughts sparked by this conversation; but I will pause here and allow you to reflect on the responses to develop your own analysis.
Again, my deepest appreciation to all those who participated!
